Labor XI · Chapter 11
Powering Up Your Skills
Use AI assistants to write complex time-series queries in seconds, and learn how to prompt them precisely enough to trust the result.
Building visualizations using ChatGPT#
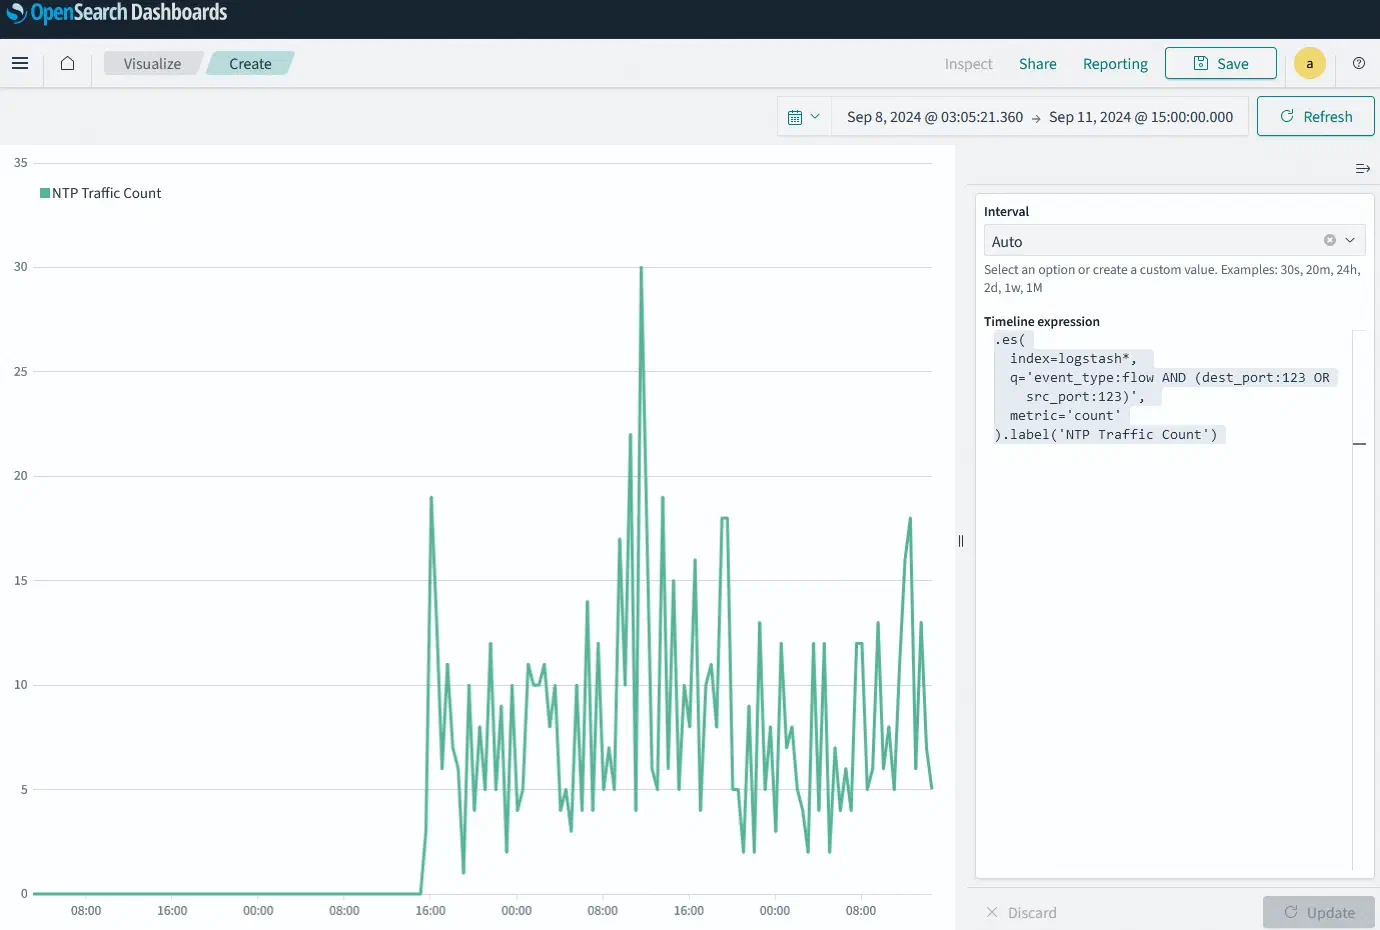
Building time series visualizations can be challenging but you can use ChatGPT to speed things up. Say that you wanted to identify NTP traffic from devices on your network.
- Go to the ChatGPT web interface.
- Type:
I want to visualize NTP traffic from devices on my network using Timelion on Kibana. My index is logstash*.
ChatGPT is more familiar with Kibana’s Timelion than Opensearch’s Timeline, but they are the same thing. 3. Its response is:
.es(
  index=logstash*,
  q='event_type:flow AND (dest_port:123 OR src_port:123)',
  metric='count'
).label('NTP Traffic Count')
Just make sure to be as specific as possible when asking ChatGPT for help.
Here’s the image of the visualization: